If you have ever wondered how effective your engagement is doing on Twitter, I have some tools for you to check out. And if you’re running campaigns or researching on Twitter there are some phenomenal FREE tools. And wrapping that all up for a report to your client is vital.
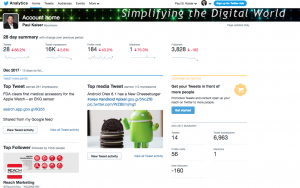
First off, if you want to look at just your account, the analytics that comes with Twitter is very informative. But make sure you have it turned on. Here is a link on how to activate your analytics and see your engagement activity.
The next tool is called TweetReach
- This tool is great for researching Twitter accounts or #Hashtags. Simply, type in any keyword, hashtag, or username, and TweetReach returns a snapshot of analytics on your search, including charts and graphs for:
- Reach
- Exposure
- Activity
- Contributors
-
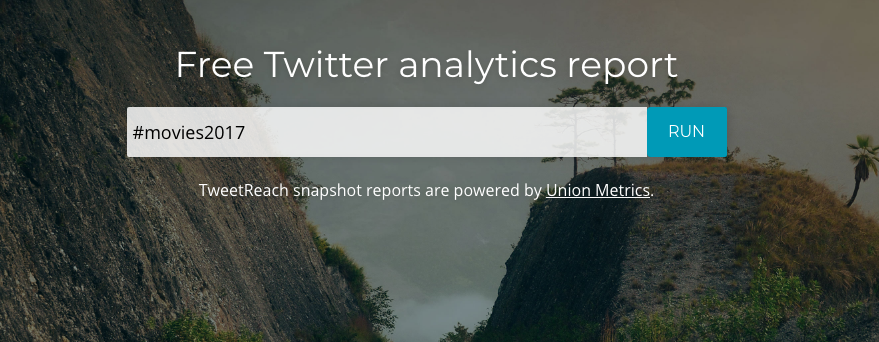
Twitter Reach can help identify influencers on Twitter through their tweets associated with a keyword and how much they influence.
- It’s quite useful for checking in on mentions of your Twitter username and tracking branded hashtags and industry keywords.
My next favorite tool is called Followerwonk. This tool helps you;
- Dig deeper into Twitter analytics: Who are your followers? Where are they located? When do they tweet?
- Find and connect with new influencers in your niche.
- Use super-actionable visualizations to compare your social graph to others.
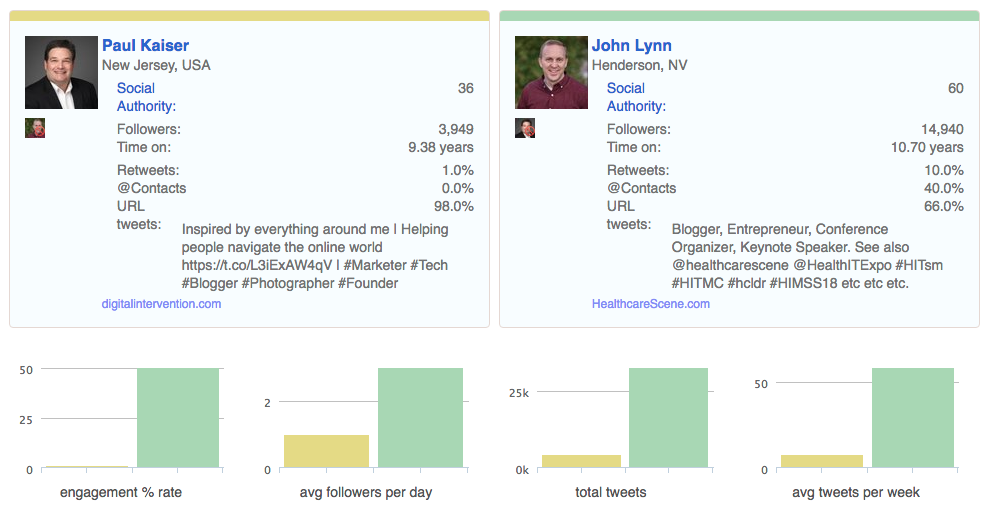
The TechGuy is doing better than me 🙂
The last free tool to show you is a tool called Keyhole.
Keyhole is a social media monitoring and campaign tracking service with a real-time, visual dashboard. It offers monitoring for Twitter, Facebook and Instagram- of hashtags, URLs and keywords. It provides insights such as demographics, location and topic clouds that can be used for identifying influencers. For hashtag and keyword tracking, it provides a wealth of information such as reach, top posts, share of posts, and more. For account tracking, you can monitor your brand’s or competitor’s engagement on Twitter, Instagram, or Facebook.
![]()
Reporting back to your clients
A social media report is simply a collection of data and stats. But sometimes you can find yourself in “analysis paralysis'” meaning to much data. And then you need to explain int in a relevant way to your client.
Which data and stats should be on there? And why? Here is a good place to start.
The answer likely depends on your specific social media strategies and goals.
- Followers tell you the number of people who wish to connect with your brand. The benefits of followers are for the reach of your content, the social proof of your brand’s popularity, and in some cases a simple vanity metric to boost your confidence!
- Clicks tell you that the content you’re sharing is of personal interest to the user. Clicks send traffic to a URL and establish your social profile as a great resource for curated content.
- Retweets tell you that the content you’re sharing is perceived as potentially interesting to one’s followers. The benefits of retweets is for advanced exposure to people who aren’t your followers and social proof that you know what you’re doing on social media.
- Favorites are somewhat of a wild card. The benefit of favorites is as a social proof metric, and beyond that, it’s a bit hard to tell what people are thinking when they favorite because there are so many different strategies and reasons (curation, appreciation, bookmarking, etc.). On some channels, favorites/likes may surface the content higher into the News Feed.
Twitter counts engagement anytime someone clicks anywhere on the tweet, including:
- retweets
- replies
- follows
- favorites
- links
- cards
- hashtags
- embedded media
- username
- profile photo
- tweet expansion
But you can do less and more points of contact based on your strategy. The other factors to producing a solid report is choosing a timeframe and presenting “what good looks like” vs your brand.
Which timeframe is most valuable to you?
Here’re the timelines that have come up most often in our discussions:
- Weekly
- Monthly
- Quarterly
- From campaign start to end
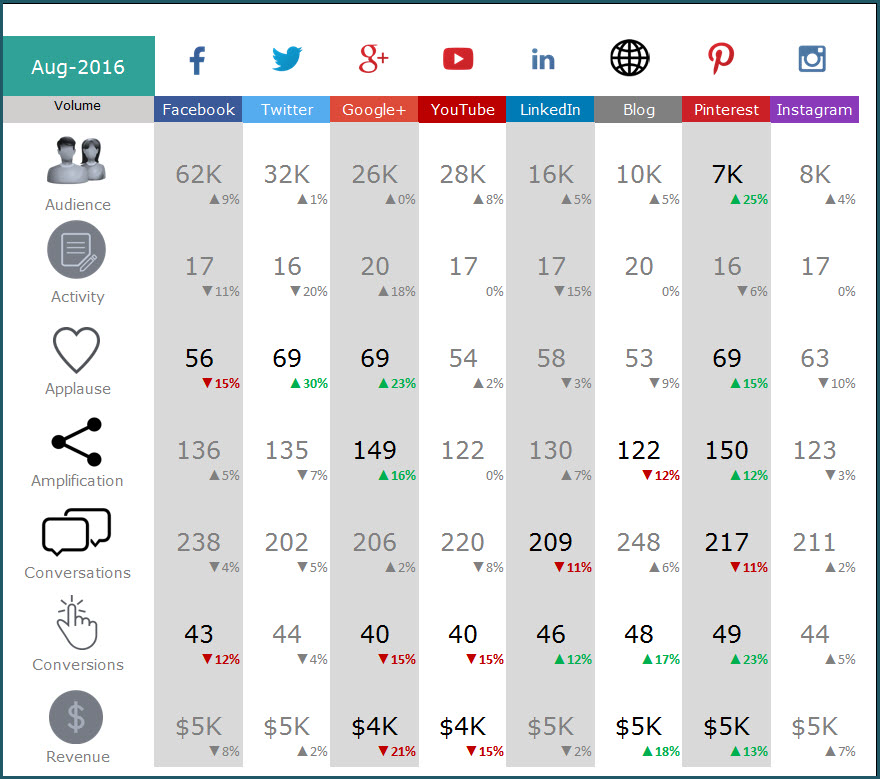
Here is one way to display your social media stats.